Gratis masterclass data-visualisaties en infographics voor jonge creatieven en journalisten, meld je aan!
20-05-2020 Hier de video van David McCandless
 Volg Graphic Matters:
< TERUG VERDER>
Naar alle berichten >
GRATIS MASTERCLASS DATAVISUALISATIE
Wil je leren hoe je effectieve, interessante en bovenal bruikbare data-visualisaties en infographics kunt maken?
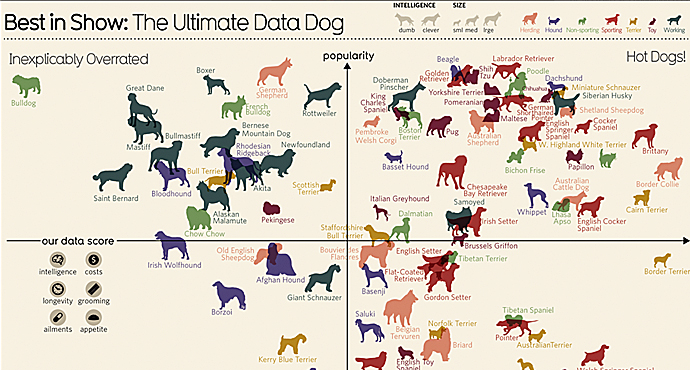
David McCandless, journalist, datadesigner en schrijver van het bekende blog Information Is Beautiful, geeft op 16 juni een virtuele masterclass over datavisualisaties en infographics. Graphic Matters biedt jonge creatieven en journalisten de kans om hier gratis aan deel te nemen!
Maar let op
• De Masterclass is Engelstalig
• De masterclass vindt plaats via de gratis Zoom app.
• De masterclass is toegankelijk voor deelnemers tot 36 jaar.
• Er zijn 15 plaatsen beschikbaar
• Inschrijven kan tot 20 mei.
• Deelnemers worden geselecteerd op basis van motivatie
• Dankzij steun van Keep an Eye is deelname gratis!
Over de masterclass
In this rare virtual workshop, David McCandless, founder of Information is Beautiful, shares his concept-driven process and method for creating successful visualisations, giving you a chance to ask questions and get feedback on your work.
Expect a fun, informative virtual experience that is interactive and hands-on. All with a solid underpinning of theory and best practice.
What will you learn?
• Concepting and the generation of good, interesting ideas ripe for visualisation.
• Creating, selecting and executing appropriate and effective charts and visualisations.
• Designing and beautifying charts and diagrams.
This workshop is for designers who:
• wishing to translate written reports, research and messaging into impactful visual form,
• wanting to better understand the practice of data journalism and storytelling with data,
• needing to succinctly communicate issues or data points to specific audiences,
• who is a “words and ideas” person looking to translate their concepts into design language,
• who is a “visual/design thinker” wanting to expand their approach to include data, who is a “data/code” person looking to improve aesthetics and conceptual


